Hanumanji

Hanumanji
Jai Hanuman Gyan Gun Sagar Jai Kapeesh Tihu Lok Ujaagar Ram Doot Atulita Baladhaama Anjani Putra Pavanasuta Naama

Tuesday, July 31, 2012

Nifty on 01-08-2012

Thus we have
A=5348-5033=315
B=5033-5234* in play can at the most do 80% of A=252=5285
B(a) looks like over today at 5034 as a 5 wave form=5033-5234=201
5033-5150=117
5150-5078=72
5078-5218=140
5218-5154=64
5154-5234=80
Thus the 3rd subwave is 175 % of 5th subwave and Ist subwave is 146% of 5th subwave.
B(b)=5034 downwards should start now to retrace 50-62% of B(a)=5135-5100 band.
B(c) would then come up again.


My above labels are guided by the negative divergence in Hour charts which are in overbought zone.
And to keep these labels valid the current upmove should not go above 5241 as that would not keep the 3rd subwave of B(a) as extended vis-a-vis 5th subwave.
So the trade for next two days is SHORT  with a Stop-loss at 5241 and target-1 below 5154 ;
target 2=5135;target3=5100


Refer following trendlines during this down move
11.45 AM
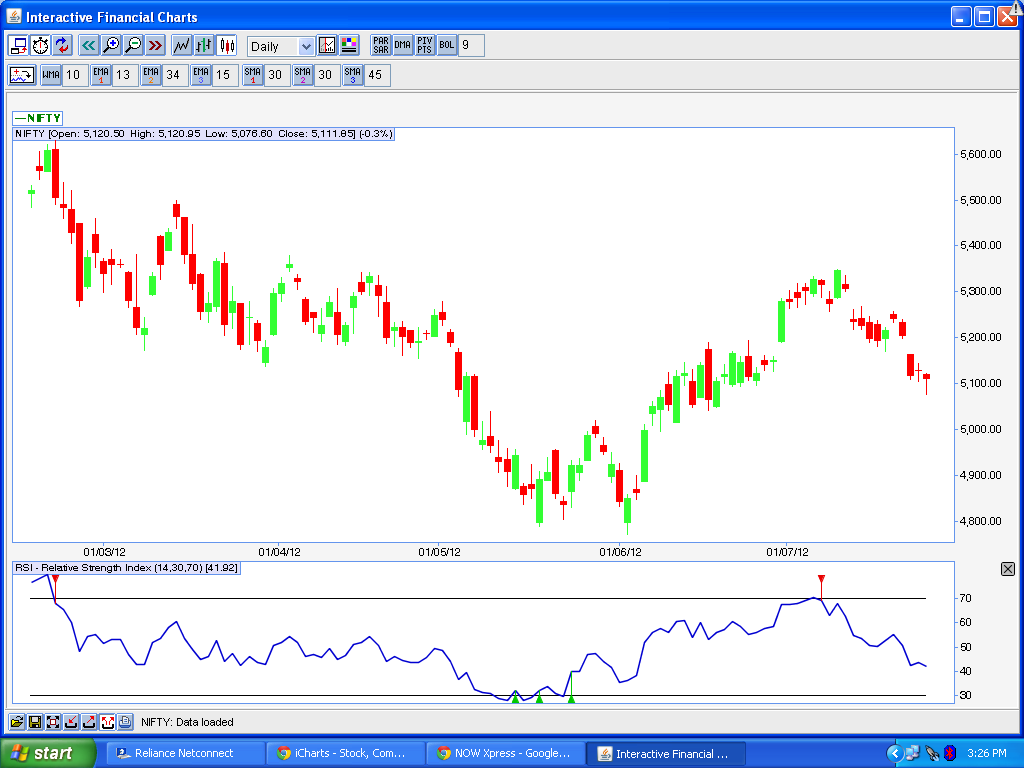
currently I am gazing at this chart:


Stop loss for shorts is now at 5234 and first target for part booking of profit is 5188
The long shot looks like this:
12.35 PM
First trade of the  day got busted---
Shall wait now--


12.50 PM
Next probability says we should not go above 5267:
2.00Pm
Just to recollect---(for late comers?? lol!!)
A=5348-5033
B retracing A
62%=5228
77%=5275
That means percentage wise we have retraced sufficient.
Now lets take form
Formwise we have to take a 3 wave Corrective form B(a),B(b)B(c).
As per the move till now it appears we have done
B(a)=5033-5150=117
B(b)=5150-5078
B(c)=5078 upwards in play
This B(c) can not do more than 1.618xB(a).
So an upper limit of 117x1.618=189+5078=5267 is fixed.
Now let us look at the form of this B(c).
Looks like doing a Diagonal:
sw1=5078-5218=140
sw2=5218-5154
sw3=5154-5246*(66% of sw1)

EOD
A flat day with ending very close to yeterday's but very important from the point of view of our pattern-position as it gave a new definition to our position vis-a-vis the pattern:

Monday, July 30, 2012

Trading Nifty on 31-07-2012


To repeat:
 (i)=5348-5218=130
(ii)=5218-5267=49
(iii)=5267-5033=234[180% of (i)]
(iv) 5033-5206*=173

a=5033-5150=117
b=5150-5078=72
5149.95-5093.3=56.65
5093.3-5113.65=20.35
5113.65-5077.65=36
c=5078-5206*=128

And this has so far been on expected lines.
However the channel for (iv) has not been tested as it should have done for an ideal zig-zag abc.
Also no negative divergence so far has been noticed(although when I look at the previous two tops,no negative divergences are noticed there as well).

Territory of (i) starts at 5217.8 and (iv) is not supposed to enter (i) so I initiated shorts at EOD with Stop-loss at 5218 and target below 5033 to complete an ideal 5 wave Impulse to the down.

And what if 5218 is breached?
That I would mention in the morning---of course before market hours--

On 5218 getting breached following probability would be preferred by me:

sw1=5033-5150=117
sw2=5150-5078=72
sw3=5078--5220(imagining 5218 gets breached).

This sw3 is likely to go upto 1.6xsw1=187=5265 and over all labels would be 
A=5348-5033=315
B(in play)=5033-5265*(expected)
C to start =A= 5265-315=4950

Accordingly the shorts should keep stop loss at 5268.

9.22 AM
Although we have come below 5205 now but the opening minutes have changed the labels----as we have breached 5218.
All rises have to be shorted --shorts closer to 5267 would be the best---with Stop-loss at 5268 and target below 5000.

9.35 AM
A few of my friends have been suggesting,particularly in view of the TL break that I should consider an immediate bottom formed at 5033 in following manner:
And they say that it is in sync with my overall labels of upmove from 4770 being a C wave with 3x3x3x3x3 form in following manner:
C1=4770-5348(3 wave)
C2=5348-5033(3 wave) and 55% retraced
C3 in play and would test 5600

Although market is supreme and a positive surprise from RBI can see markets rushing up but going by my understanding of EW this probability is not my preferred one at present.

In fact I am waiting for the Hourly close at 10.00AM to see if it closes above 5222(Hourly closing low of (i)=5348-5217.8.) 
11.45 AM
Being the conservative that I am,I am considering the labels as I was doing till today morning:
To repeat:
 (i)=5348-5218=130
(ii)=5218-5267=49
(iii)=5267-5033=234[180% of (i)]
(iv) 5033-5218
(v)5218---downwards--- minimum 0.62x(i)=81=5137
Below 5137 I would look for weakening momentum to close my shorts and go long again.
Stop loss for shorts at 5207 now


(v) not going below (iii)--a probable truncation---usually does not take place in A wave.
And also a truncation usually takes place only if (iii) is super extended which is not the present case.
So logically we should go below 5033


2.12 PM
Tough day---SL gets triggered. Better to sit aside and wait for EOD
2.40 PM
Still waiting for Hourly close above 5222 to officially invalidate the count.


EOD: Finally closed above 5222 to confirm the invalidation of labels.
Not a good day.
For two reasons:
1. Doubts crept in mind as it breached 5218 in opening minutes and then went down -- such close shaves are not frequent but I was happy to see the red, particularly when after RBI policy the red persisted.
And the 11.45 chart posted( just notice the channel support and upmove after that)-- 
2.Seeing profitable positions not getting converted into real time gains is painful--and this is what happened today.


Let me get back to the pattern chart posted two day ago--
 Now this pattern has to be seen as below:
Courtsey Piyush Sharda we have a better explanation for A as a 5 wave form:


The 5 subwaves of A:
(i)=5348-5218=130
(ii)=5218-5267=49
(iii)=5267-5076=191 has very clear fractals:
5267-5169=98
5169-5257=88
5257-5108=149
5108-5144=36
5144-5076=68
(iv)=5076-5126=50
(v)=5126-5033=93

Thus we have
A=5348-5033=315
B=5033-5234* in play can at the most do 80% of A=252=5285
B(a) looks like over today at 5234 as a 5 wave form=5033-5234=201
5033-5150=117
5150-5078=72
5078-5218=140
5218-5154=64
5154-5234=80
Thus the 3rd subwave is 175 % of 5th subwave and Ist subwave is 146% of 5th subwave.
B(b)=5034 downwards should start now to retrace 50-62% of B(a)=5135-5100 band.
B(c) would then come up again.


My above labels are guided by the negative divergence in Hour charts which are in overbought zone.
And to keep these labels valid the current upmove should not go above 5241 as that would not keep the 3rd subwave of B(a) as extended 
Raghu

Nifty on 30-07-2012

1.55 PM


3.25 PM

Looking for Perfection ???


Looking for Perfection ???


'The stock-market includes some of the most brilliant minds and some of the deepest pockets on Earth. Arguing with this group is dangerous business, and it has to be done very cautiously.There is no certainty, only odds. Here you have two goals—to make money and to learn. Win or lose, you have to gain knowledge from a trade in order to be a better trader tomorrow. Scan your fundamental information, read technical signals, implement your rules of money management and risk control. Now you are ready to pull the trigger. Go!"
---Dr. Elder Alexander

Following newspaper reports and TV channels,one gets enamoured by "break-outs" and"break-downs". These two terms get so deeply ingrained into our mindset that despite being "the cause" of a retail trader's accumulated losses, one never stops looking for them to enter fresh trades. Losses are blamed on luck as it was a pure bad-luck that when I entered the long side of a trade on "break-out"(or short side of trade on "break-down"),it turned out to be a "false break-out"(or "break-down").Has anyone kept a detailed record of losses caused by "false" break-outs/breakdowns vis-a-vis profits generated by the "real" ones ?
Second in my list is cross-overs---- 5/10 emas cross-over being the most common.While at smaller t/f(upto an Hour),it may be a good idea to initiate trade on these x-overs, waiting for it to happen on Daily charts would only give some "butter-milk" while cream would be usurped by smarter ones who "catch it early".
Third ,and though not the last one but I would keep it at that, is the lure of buying Out of Money(OTM) Options that proves to be the nemesis of many a retail traders.

I have mentioned these three reasons as the major mental-blocks of retail traders as during my discussions with fellow traders in my brokers' place, on FB groups & blogs --- these are the most debated points, so much so that in real life interactions I have stopped raising them --- 
:-)

Then what guides me in my trades?
Primarily same things which guide any other trader--
1. Trendlines(channels);
2. Momentum indicators like RSI,Stochastic & MACD;
3. EW labels.

Then how am I different?

Let me try to give brief explanation--rest will be done by my trade - illustrations as we move along---
In trendlines,I see instead of break-outs/breakdowns, the potential of reversal---and momentum indicators (through overbot/oversold levels & divergences) and EW counts help me in calculating my odds for/against such reversal. 
If such a reversal happens, it gives me major gains but if it doesnot ,my losses are very limited.
And thats what trading in stock-market is all about ---maximizing gains and minimizing  losses. 


Dear friends
13-08-2012 is the first anniversary of this blog. To take my endeavour a step further,I am initiating a new blog titled "Jackpot Trades" the link to which appears on the right hand side bar of this blog.
This post is the first post of that blog and it would be open to invited viewers only.Those who are interested in getting an invite to my new blog ,may drop in a word at my email ID -- sanjayraghuvanshi1965@gmail.com
(corrected now)
As far as today's trade set up is concerned, my detailed EOD post of 27.07.2012 should suffice---


Raghu

Friday, July 27, 2012

Nifty : EOD 27-07-2012

50DMA=5106
100DMA=5154
150DMA=5149
200DMA=5103
Thus Nifty has closed below all major DMAs indicating weakness but is our (iv) over?

To repeat:
 (i)=5348-5218=130
(ii)=5218-5267=49
(iii)=5267-5033*=234[180% of (i)]
(iv) 5033-5150*=117=50% of (iii) retraced.
As the gap-up does not allow us to confirm the wave-form and percentage wise there is a good chance of (iv) being over, I turn to RSI/Stoch in Hour charts to see how it stands:
And it tells me that there is scope of (iv)  continuing on Monday to give us a 3 wave form in following manner:
a=5033-5150=117
b=5150-5078=72
5149.95-5093.3=56.65
5093.3-5113.65=20.35
5113.65-5077.65=36
c=5078--up by minimum 0.62x117=73=5151


In these days of global uncertainties,gap-ups and gap-downs because of some global events have become very common.However,despite the gap-up /gap-down, market falls into its overall pattern very fast. So in the most likelihood we would open gap-up on Monday morning but not go very much up. If we open up in the gap 5160-5198,we may go on to fill the gap .Otherwise this gap is likely to act as a good resistance giving us 5160 as the shorting point.
Thus we have two shorting points--5160 and 5198.Stop loss for shorts so created would be 5218(territory of (i).


Now let us think "ulta"---if some global mishap occurs and we open with a gap down then we shall have to label (iv) as over at 5150 and (v) in play.As (i)=5348-5218 was 130 points,this (v) has to be minimum 0.62*130=81 i.e. minimum (5150-81=5069)--so a gapdown below 5069 would mean (v) in play which would ideally take us below 5033 .
Then 4990-5020 should be used for going long again.

Thus net-net ,as a thumb-guide,one can use following TLs for initiating a trade---finetune your entry on long or short side by looking for divergence/x-overs in 5 min charts:


In this manner,remembering our pattern would not allow gap-up or gap-down to dislodge us.

Trading Nifty on 27-07-2012

Today is the first day of August series.
I am attempting--on the basis of my EW labels--following roadmap for the series:

To explain it further,I see the first half of the series oscillating in 5175-5000 range and would be paeking around 5225 .From the peak of 5225 we would fall to sub 5000 levels again by the end of the series.

Would be putting up the above chart during the course of the series to monitor our progress.
Happy trading---
12.06 PM
The (iv) of A,supposedly in play from 5033 upwards is retracing (iii)=5267-5033=234
50% reracement means117=5150--done
62% means 145=5178
This (iv) has to be a 3  wave form --abc-- but in a gap-up one is left guessing.
Ideally a gap-up means an Impulse---in current case a of (iv)=5033-5130
then b=5130-5102=28
c minimum 0.62*a=60 means 5162 should be seen---
2.38 PM
EOD

Would post the detailed Nifty probabilities during week-end---
For now,let me try looking into RBI policy through SBI charts----
Oersold on daily charts
Positive divergence on Hour chart
resting on trendline
EW says exp flat done--
Is it waiting for RBI policy to go to further down or jump-up from this perfect point?

Thursday, July 26, 2012

Nifty EOD-26-07-2012

So my  morning's observations that:
Q
if Nifty goes below 5057,then this downmove would no longer remain a 3 wave form and shall have to be labelled:
sw1=5348-5218=130
sw2=5218-5267=49
sw3=5267-5055*=212(163% of sw1) extended rd wave of a 5 wave form
sw4=to retrace this sw3 by 50% or more i.e. go upto5160 again.

This particular Probability is being mentioned primarily because of two factors:
1. RSI not being in oversold zone in daily charts
2.Time taken by the downmove from 5348 is not much.
UnQ


proved correct and the downmove from 5348 has to be now labelled as A of ABC corrective(called C2)in play. To make the perspective clearer let me again repeat the previous episodes:
Thus C1=4770-5348=578(3 wave form)
C2(also to play out as a 3 wave form ABC whose A is in play as a 5 wave Impulse with an extended subwave(iii) in following manner:
(i)=5348-5218=130
(ii)=5218-5267=49
(iii)=5267-5033*=234[180% of (i)]
Now I believe that this (iii)would have ended today---for two reasons--
1.Positive divergence between RSI and Price--
2.Fractals of this(iii) are quite discernible and can be seen as:
5267-5169=98
5169-5257=88
5257-5077=180(184%)
5077-5127=50
5127-5033*=94
thus making a picture perfect 5 wave form--though this last subwave can do more(upto 1.6x98=157)--so any further downslide should be used to go long with stop-loss at the 5127-157=4970 point.

In view of the deeply oversold Hourly indicaters,positive divergence and picture perfect 5 wave form for subwave(iii)--I expect Friday to take us into green territory for 2-3 days as subwave(iv) of A.
To repeat:
 (i)=5348-5218=130
(ii)=5218-5267=49
(iii)=5267-5033*=234[180% of (i)]
(iv) to start now and as (ii) had retraced only 38%of (i)--and also the deep oversold position of many Nifty stocks--I expect (iv) to retrace minimum 50% of (iii) i.e.115 odd points
so 5160---here we come again

Raghu

Nifty on 26-07-2012


As C1=4770-5348=578 in 27 trading sessions
C2 if it retraces 50% of C1,its target is 5059
and if it retraces 61.8% of C1,its target is 4990
C2 also has to be a 3 wave corrective form
so far it has completed 11 trading sessions and today would be its 12th i.e. time taken vis-a-vis C1 has been only 44% so far and although a 3 wave form is nearing completion,RSI-14 is not in oversold zone as yet.
I am labelling this C2's fractals as:
A=5348-5218=130
B=5218-5267=49
C=5267--downwards
c1=5267-5169=98
c2=5169-5257
c3=5257-5077
c4=5077-5120* in play currently and likely to remain limited to 5150
c5--down again to complete C as an ideal 5 wave form

This c5 has to be minimum 0.62*c1 and maximum 1.6*c1 i.e. it can range from 61-157 points i.e if c4 ends at 5150 then c5 can bring Nifty down to a range of 5089-4993
If it does only upto 5057 the abovementioned fractals of C2 would hold good with
A-5348-5218=130
B=5218-5267=49
C=5267-5057*(projected)=210
However,if Nifty goes below 5057,then this downmove would no longer remain a 3 wave form and shall have to be labelled:
sw1=5348-5218=130
sw2=5218-5267=49
sw3=5267-5055*=212(163% of sw1) extended rd wave of a 5 wave form
sw4=to retrace this sw3 by 50% or more i.e. go upto5160 again.

This particular Probability is being mentioned primarily because of two factors:
1. RSI not being in oversold zone in daily charts
2.Time taken by the downmove from 5348 is not much.

On the contrary,if today morning,we go above 5169 then we shall have to conclude that an immediate bottom has been formed at 5077 and gear up for another 200 points upmove--to take pause at 5350 levels.

Then how to set up trade in the light of all the above details---with different probabilities?
I would go short near 5150 with stop-loss at 5170 and target minimum 61 points down from day's high.
And if 5169 is taken out then it would be time to go long at all dips for target 5350.


9.25 AM
This trendline breach would say that c4 is over----but the time taken is too small---would it mean that only A of c4 over--- that sounds more logical--

looks like diagonal A=5077-5126=49
B in play
C to go up again:
Name:Sanjay Singh
Present City:Gurgaon

10.24 AM
This is for ribu--- but with a caveat---these being very small degree waves,I donot consider them tradable but for understaning the concept you should follow them--
10.45 AM
Likely road map for the day---put stop losses properly---Happy trading--I'm off for the day

Raghu

Wednesday, July 25, 2012

Nifty on 25-07-2012

Starting premise remains same as yesterday:
Q
If 5097 gets breached in the morning itself(i.e c3 gets extended),we may see an intraday recovery to 5150(as c4) but again fall to levels below c3(to complete c5).
If 5097 remains unbreached,we may keep grinding & inching upwards----as c4 to build a diagonal C ---
UnQ

To recall the downmove from 5348 till this day:
A=5348-5218=130
B=5218-5267=49
C=in play from 5267 downwards--can do a maximum 1.6xA=5056 as an Impulse or diagonal
c1=5267-5168=99
c2=5168-5257=89
c3=5257-5104*
(i)=5257-5197=60
(ii)=5197-5220=23
(iii)=5220-5108=102
(iv)=5108-5144=36
(v)=5144---should do minimum 0.62*(i)=37.5=5106 and ideally (v)=(i)=60=5084


As the next wave expected is c4---so it is likely to be all grinding and slow moving day--worsened further by series-expiry day being very close--- Intraday direction is likely to be up--
How much up?
Depends upon the ending of (v).If 5097 is breached,today's intraday upmove would not go above 5160.
If 5097 remains unbreached,we may cross 5200 if not today then tomorrow

10.04AM
Watching closely:
c1=5267.15-5169.05=98.1
c2=5169.05-5257.75
c3=5257.75-5096.35*=161.4(164% of c1)

so c3 has become extended subwave .
c4, therefore would not go into c1 territory---retracement to be limited to 5140-5160 band now--

1.59 PM
one 5 wave form looks complete:


so a small retracement to 5100 and then a push up to 5140 is likely

3.10PM
May keep hanging here itself---to open with a gap-up in the 5140-5150 band and then come down to sub 5075 levels tomorrow--

3.26 PM
Hammer on daily charts:

EOD
c4.a=5076-5119=43
c4b=5119-5105=14
c4c--- 5105+ minimum 27=5132 is likely tomorrow

And then a slide down again as c5 to do minimum 0.62*c1=61 points meaning if we do 5140 in the morning as c4c then c5 doing its minimum 60 points would not take it below 5076(today's low)--- and a truncated c5 would mean a fast retracement to beginning of C i.e. 5267-----
so tomorrow morning--5140
Intraday low minimum 5080--


Rest as we proceed--

Raghu

Tuesday, July 24, 2012

Nifty on 24-07-2012

As A was a fast & furious Impulse, chances of C being a diagonal were always emphasized by me.
A had taken 45 trading sessions--
C has already done 36 sessions and now the likelihood of its taking the form of a 3x3x3x3x3 diagonal is very high.Going by Fibonacci correlation,it may take upto 73 sessions(1.618 times) to reach its target. This Target Ideally C=A=5900+


Now lets have a look as to how this C has done so far:
(Please bear in mind that now we are taking C as fanning out in the form of a 3x3x3x3x3 diagonal:
Now,as shown in the chart above:
C1=4770-5348=578
C2=Targets 50% retracement=5059-----62% retracement=4990 
Inside the C2:
A=Impulse=5348-5218=130
B=5218-5267=49
C=5267 downwards in play can do a maximum of 210 points(1.6xA)=5056
c1=5267-5168=99(as a diagonal)
c2=5168-5257
c3=5257-5108*=149(150%)--this is where we stopped yesterday--ideally this c3 should be doing minimum 1.62*c1 and that is why yesterday I had given the target of 5097.
By not doing 1.62*c1, doors were kept open for c4 to go above 5168(even upto 5257) and c5 to come down again by more than 149 points


So today,if we open below 5097,then we may go upto 5150-60 (as c4 )and come down again (as c5) to end the wave at 5060-5070.
However,if 5097 remains unbreached then we may go up to not only fill the gap at 5198 but even upto 5225 --in following manner:
Conclusion:
If 5097 gets breached in the morning itself(i.e c3 gets extended),we may see an intraday recovery to 5150(as c4) but again fall to levels below c3(to complete c5).
If 5097 remains unbreached,we may keep grinding & inching upwards----as c4 to build a diagonal C as shown in the chart above.
2.50PM


Why I wrote C3(if ended) because the subwave4 of C3 might have played out as an Exp Flat as shown in chart below--keeping the option of subwave5 of C3 open to go below 5097
EOD:
Nothing more to add----C4 & C5 are in pending list.And C3 has not become extended as yet(keeping the option of C playing a diagonal--with C4 going into C1 territory---open.)
As number of shorters--primarily because of global sentiment---being very high,they are likely to be squeezed by a slow,grinding but ascending C4 going upto even 5225----however this probability assumes that C3 will not get extended i.e. Nifty will not go below 5097 tomorrow at opening time.
If it does,then C4 will be shallow and remain below 5160--- but remember even if we open below 5097, we will keep grinding the whole day tomorrow in 5100-5160 range.


Raghu

Monday, July 23, 2012

Trading Nifty on 23-07-2012

Starting from my last posted chart & quote:
Above EW position is based on strictly the wave form. The Impulse 5168-5258=90 has to be retraced by a 3 wave corrective. Though it has already retraced 60 points out of 90(66%) but not as  corrective 3 wave form.So on Monday we may open at 5230-5235 levels to slide down to sub 5195 once again to complete the wave form as shown in chart above.
UnQ

In view of global clues,the expected opening of 5230-5235 looks unlikely and instead we are likely to open gap-down. Now the crucial question is --will 5168 hold? If it does then our previous labels hold good wherein:
A=5348-5218=130
B=5218-5267=49
C=5267-5168=99

However, if 5168 does not hold then we have to modify the labels as:

A=5348-5218=130
B=5218-5267=49
C=5267- downwards as an Impulse or Diagonal wherein
C1=5267-5168=99
C2=5168-5257=89
C3=5257 downwards(if extended) should do 1.62x99=160=5097
(200 DMA currently stands at 5099)
As per trendlines--first support is indicated at 5135 levels:
9.10 AM
As 5168 breached at end of pre-open itself---we have to take C3 in consideration from 5257 downwards
12.30 PM
No Price-RSI divergence noticed so far---
EOD
As C3 has not done 1.62xC1 so depending upon how C4 acts--probability of a diagonal can not be ruled out--i.e.we may fill the gap tomorrow and then come down again by more than 150 points---